01
Image uniformity
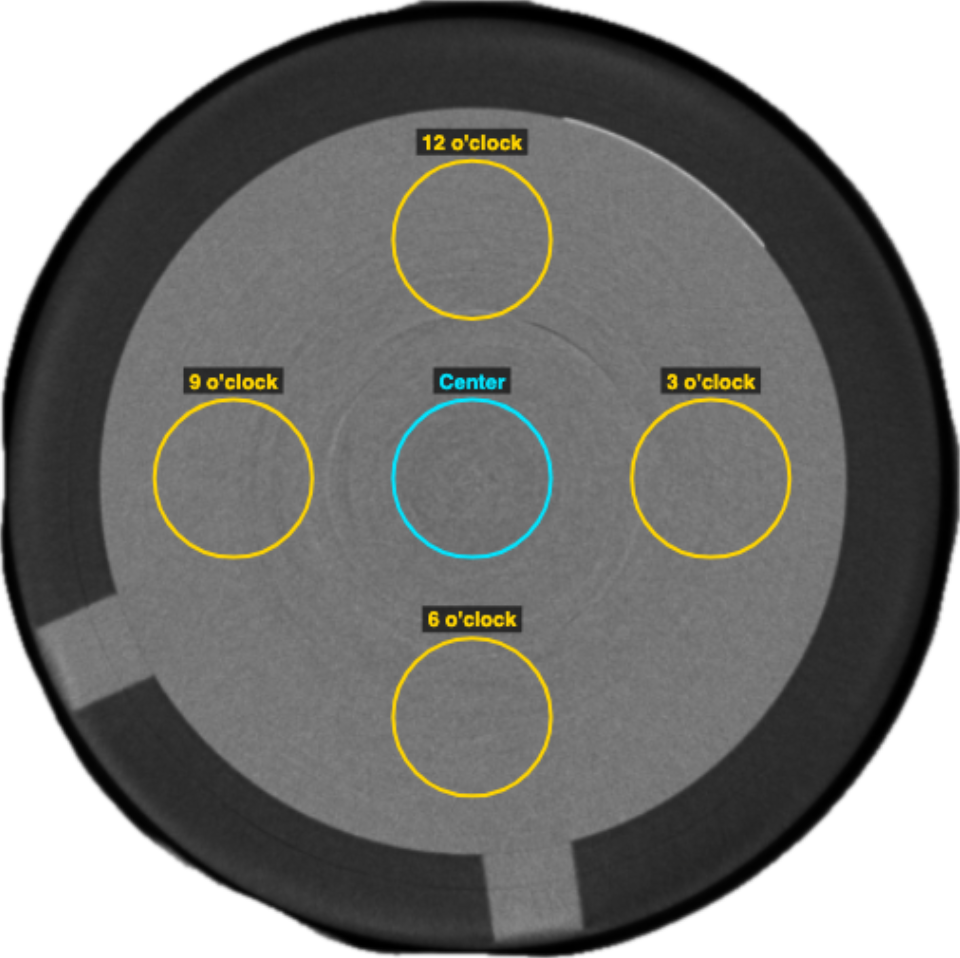
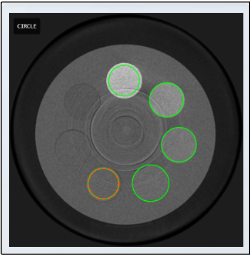
Centre and four peripheral regions placed automatically from a single traced
circle, sized to the recommended area and kept clear of the phantom edge.
Measured in Hounsfield units with per-energy-bin tolerances and a per-region
diagnostic breakdown.
02
Artefact assessment
A structured visual check for ring, streak, shading and blooming artefacts.
Each review records the image type examined, the findings, the reviewer and
the timestamp, building a permanent log suitable for daily use.
03
Signal-to-noise ratio
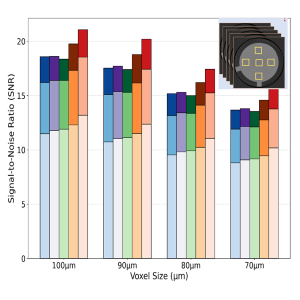
Mean, standard deviation and signal-to-noise measured per region and per
energy bin, averaged across the series with dispersion reported. Judged
against a baseline tolerance or an absolute minimum; perfectly uniform
regions are reported as undefined rather than zero.
04
Contrast-to-noise ratio
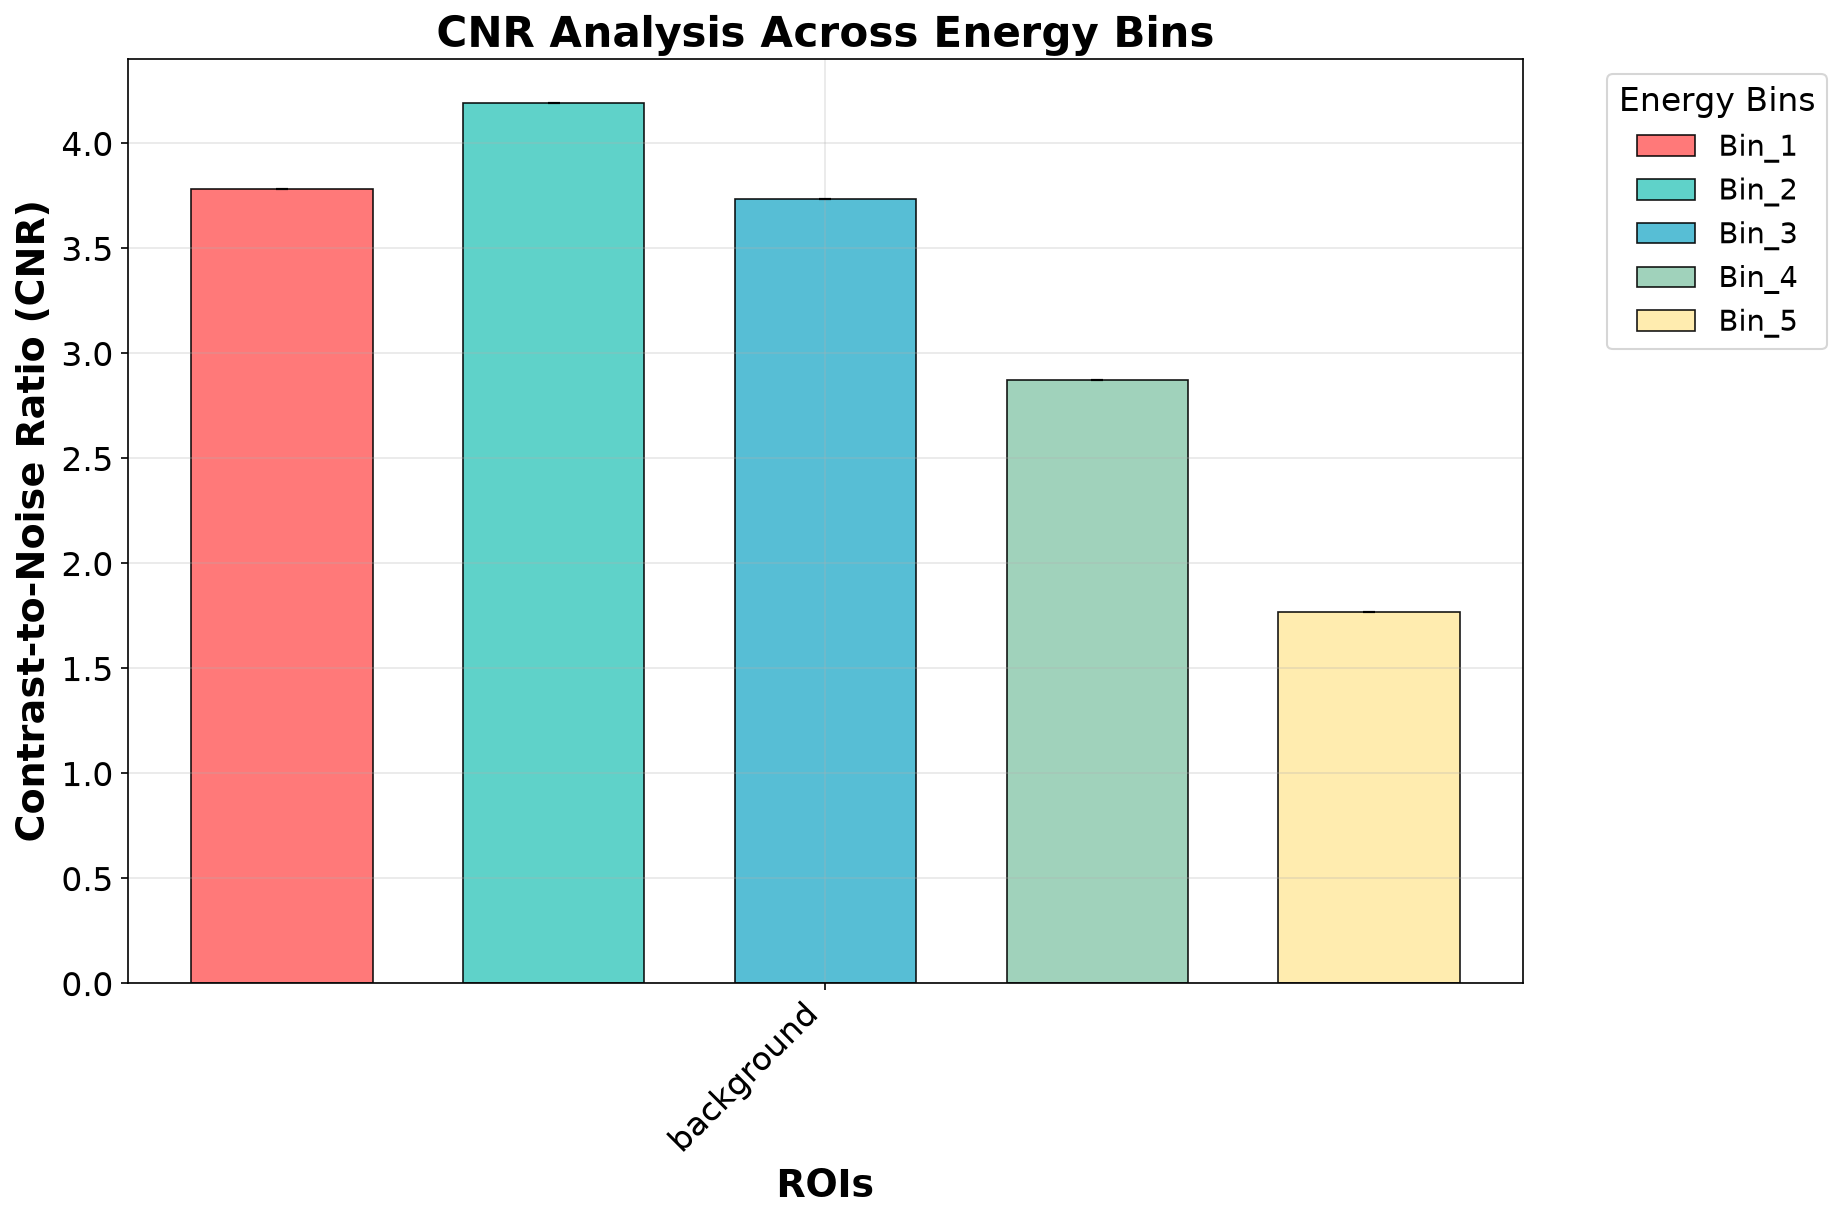
A background region sets the reference level and the noise; any number of
signal regions are then compared against it, per energy bin. Supports a
baseline tolerance or an absolute minimum such as the common low-contrast
threshold.
05
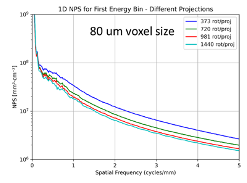
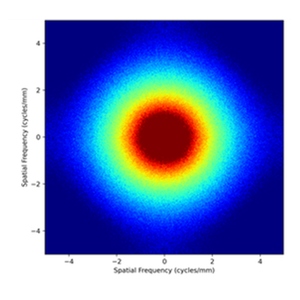
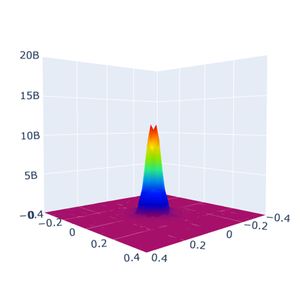
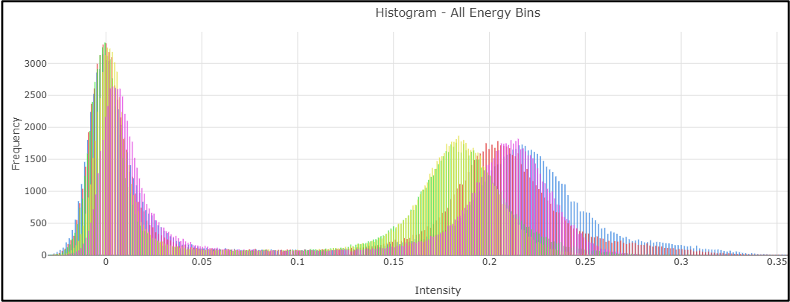
Noise power spectrum
One-, two- and three-dimensional noise texture with peak and average frequency
as summary metrics. Multiple regions averaged for stability, resolved per
energy bin, with normalisation verified against a known analytical identity.
06
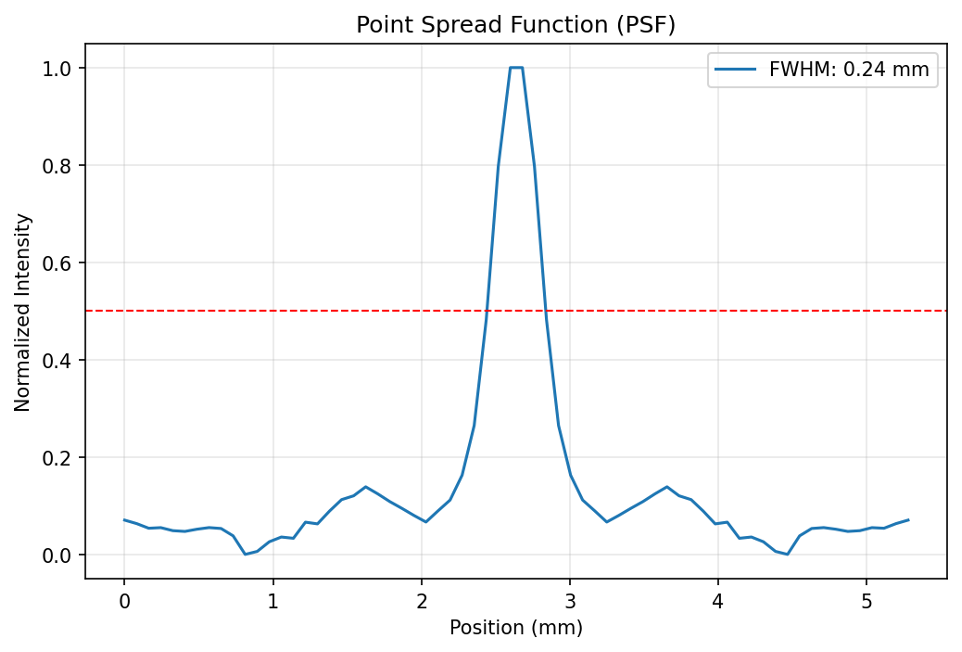
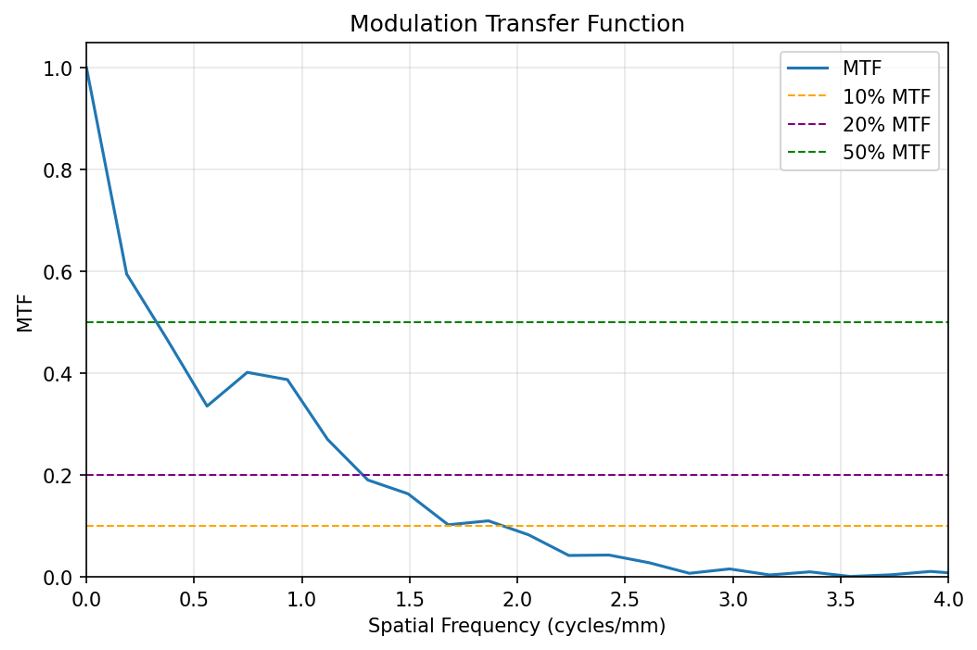
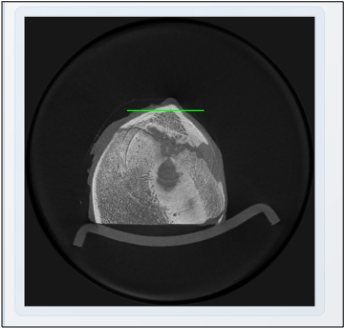
Spatial resolution
Derived from point sources, wires or a high-contrast edge. Reports full width
at half maximum together with the spatial frequencies at 50%, 20% and 10%
modulation, per energy bin and averaged, with baseline evaluation.
07
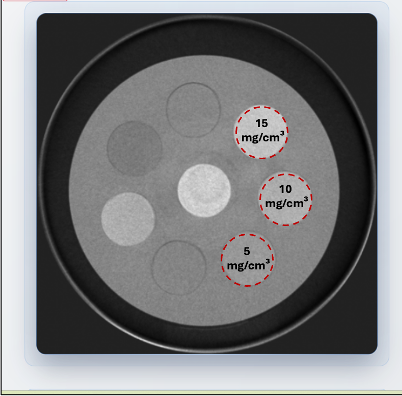
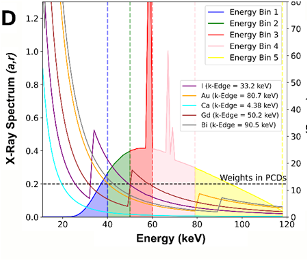
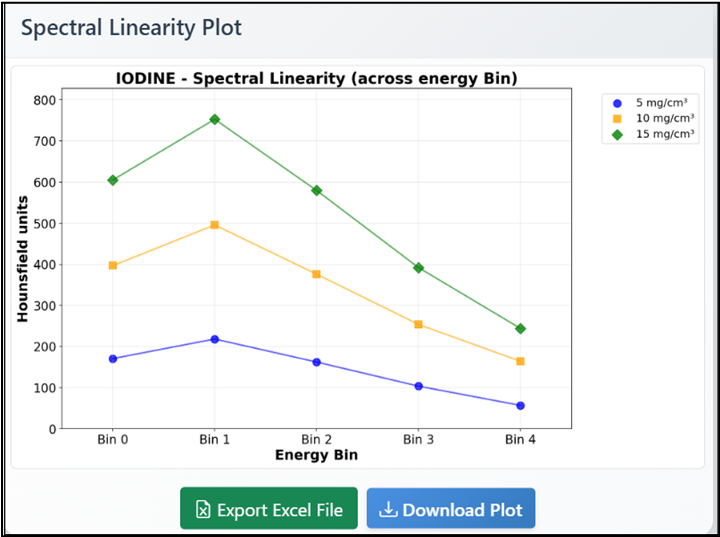
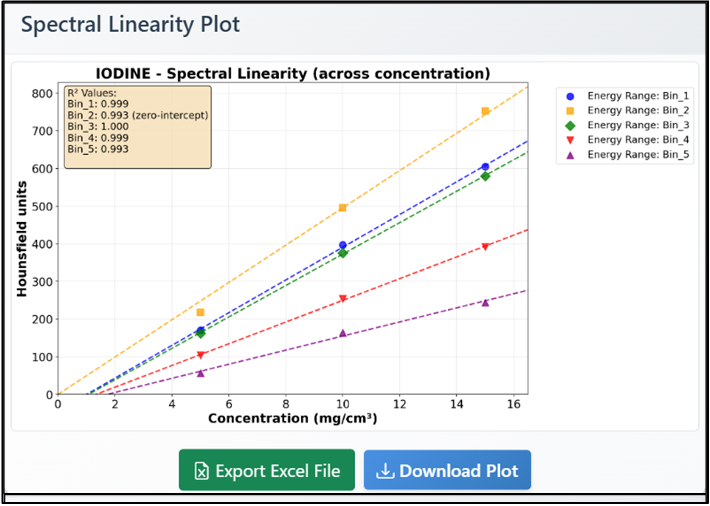
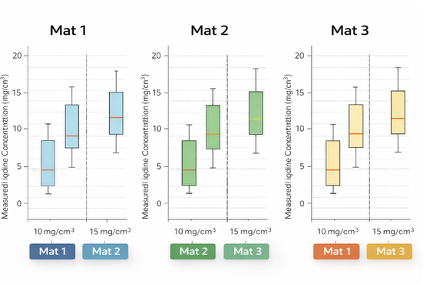
Spectral linearity
How a material's response varies across energy bins and across concentration,
in Hounsfield units or linear attenuation. Air and water referencing is built
in for systems that do not provide calibrated values.
08
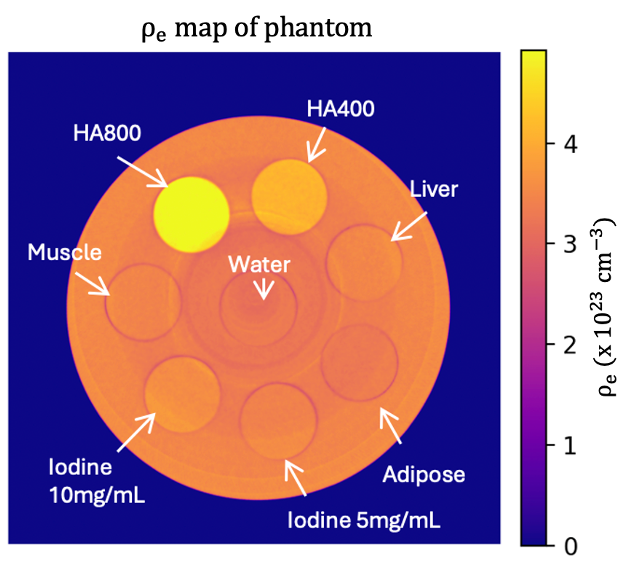
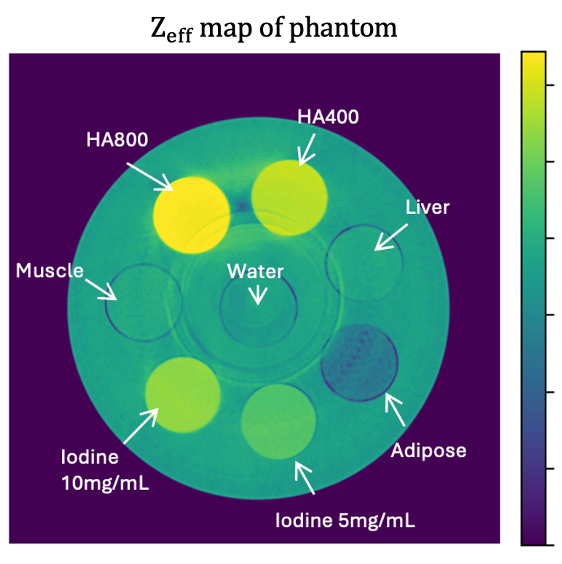
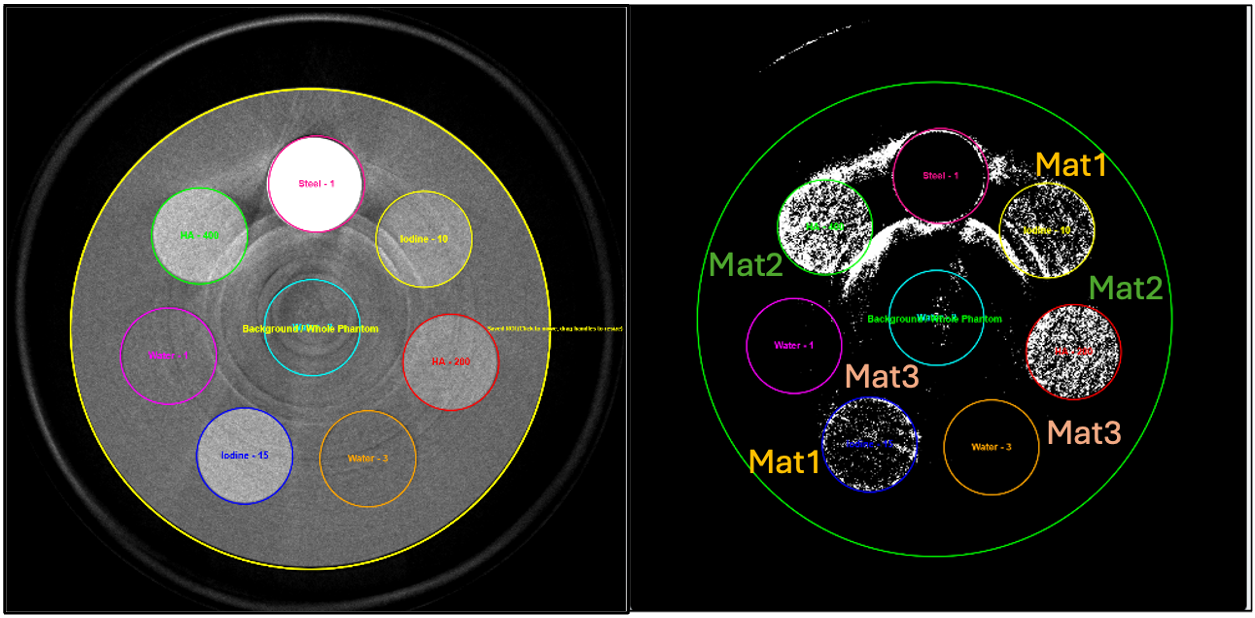
Electron density & Zeff
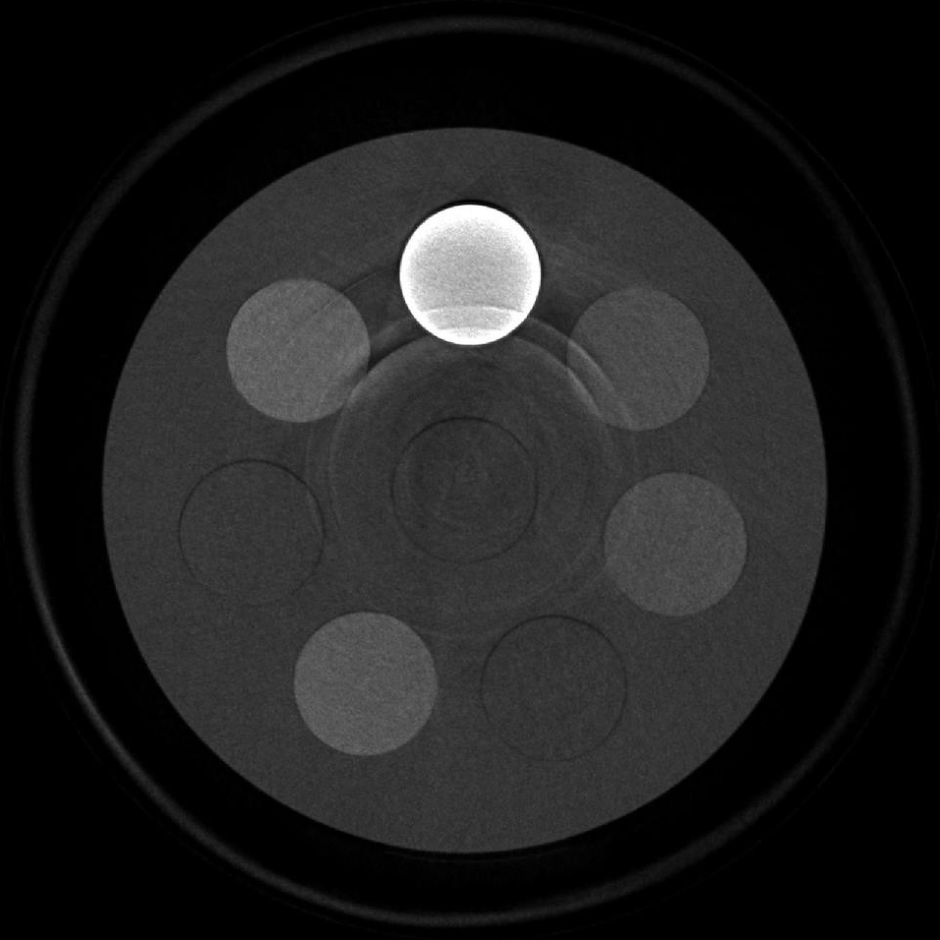
Each tissue-surrogate insert measured against its known reference value, with
the region sized automatically to the recommended fraction of the insert so
the boundary is never included. Tolerances are set by the physicist.